TPI Progress Reports
Click here to view an infographic report highlighting TPI outcomes from 2020 
Click here to view the 2015-2019 Achievements Report which provides an overview of the Initiative, its history, partnerships, and early impacts of key strategies.
TPI Community Outcome Indicators
Community outcome indicators, including trauma hospital visits and violent crime rates, are used to estimate impact of TPI strategies, using the year prior to implementation of each strategy as baseline. While TPI overall began in 2015, HBVI implementation started in July 2017, and Street Outreach in June-July 2018.
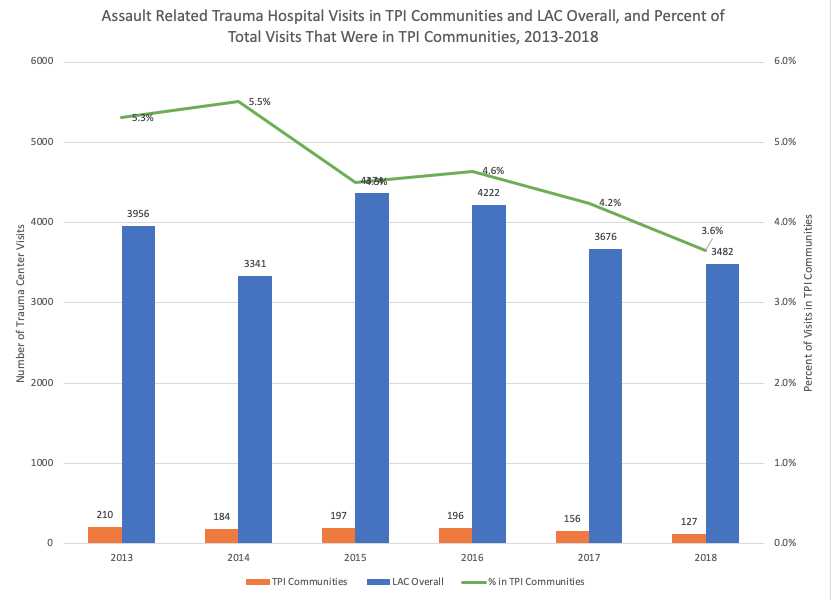
Trauma Hospital Visits
TPI receives annual data from the LA County Emergency Medical Services Agency that includes assault-related trauma hospital visits. Trauma visits include severe injuries that are transported to hospitals with a trauma center designation, where individuals receive specialized care for violence related injuries, including shootings, stabbings, and blunt force.
Between 2015 and 2018, one year into HVI implementation, TPI communities saw a 37% reduction in assault-related trauma hospital visit rates, compared to a 21% reduction in LA County Overall; and reduced their burden of countywide assault-related trauma hospital visits from 5% to 4%.
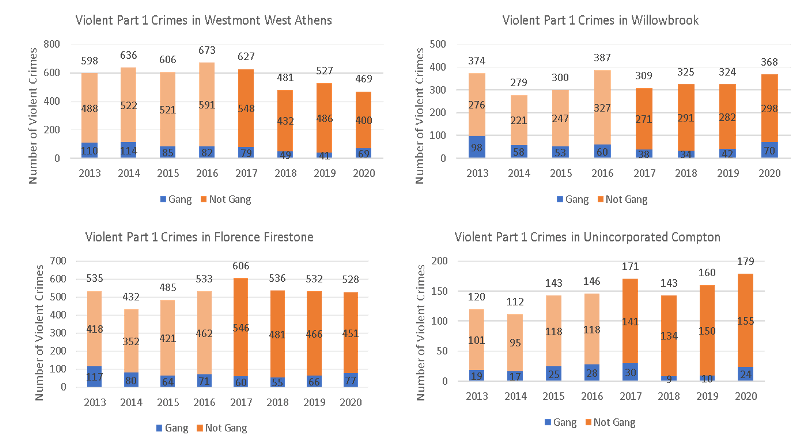
Crime Trends
TPI receives monthly crime data from the Los Angeles County Sheriff’s Department. This includes Part I serious and violent crimes: aggravated assault, arson, burglary, criminal homicide, forcible rape, grand theft auto, larceny theft and robbery. Sheriff’s Department also includes a variable to identify crimes as “gang-related” however it is not clear how consistently it is defined and reported.
Overall among the four communities, violent crimes peaked from 2016 to 2017, the first year of HBVI implementation, and the year before Street Outreach implementation. Between 2016 (the year before Street Outreach implementation) and 2020, violent crimes in 2 communities declined, while unincorporated Compton increased and Florence Firestone remained steady, showing promising early results. Westmont West
Athens and Willowbrook, which have had ongoing community engagement infrastructure, saw the greatest declines. Assessing impact of COVID-19 pandemic on 2020 increases.